Tracing
Tracing is exceptionally useful at times to tune application performance or understand application flow for debugging. Go comes with excellent tracing in the runtime/trace package that works extermely well in most cases. With careful use of the Region feature, it’s possible to get abundant information about the range of events that occur during the execution of the code being investigated.
However, when the performance of your applications start getting to the point where microseconds are slow and milliseconds aeons, the ability to trace your code seems to hit the computational equivalent of the uncertainty principle. The time-profile of the very act of instrumenting your code starts getting close to or even higher the time-profile of the code being instrumented.
runtime/trace can still be useful to get to the bottom of specific issues, but for exploratory investigation of low-latency code, the impact it has on performance might itself impact the application flow.
Magic Trace
I have found Magic Trace to be a great alternative for collecting a wide range of high-resolution trace of the application run, with minimal impact on the performance. It is especially useful for idea generation. Once there are a few potential avenues for investigation, it’s easier to validate those ideas using tests, micro-benchmarks, or even use runtime/trace to dig deeper.
Magic Trace uses Intel Processor Trace (IPT) to generate these high-resolution traces with minimal overhead.
What about caveats? There’s a few:
- Hardware needs to support IPT. Check with:
grep intel_pt /proc/cpuinfo - Works only on Linux
- Data collection over a (depending on your outlook) short period of time (approximately 5-20ms depending on resolution).
- Go is not officially supported
To download and install magic-trace, please check https://github.com/janestreet/magic-trace
Build Go
While Go isn’t officially supported by magic-trace, it seems to be straightforward to make Go applications compatible. Go code built with the flags -gcflags=all="-N -l" works with magic-trace. I have not encountered any major issues using it.
Replace
output-binarywith desired binary name in the following commands.
| |
Run and attach
Run the appplication:
| |
Attach magic-trace to the application, wait a couple of seconds and hit Ctrl-C to stop the trace and convert the recording to an output file.
| |
| |
Read the trace
Magic trace generates output compatible with Perfetto. Jane Street also provides a version of Perfetto at https://magic-trace.org/
Click Open Trace File and select the trace file. The timeline page will show a visual snapshot of the trace:
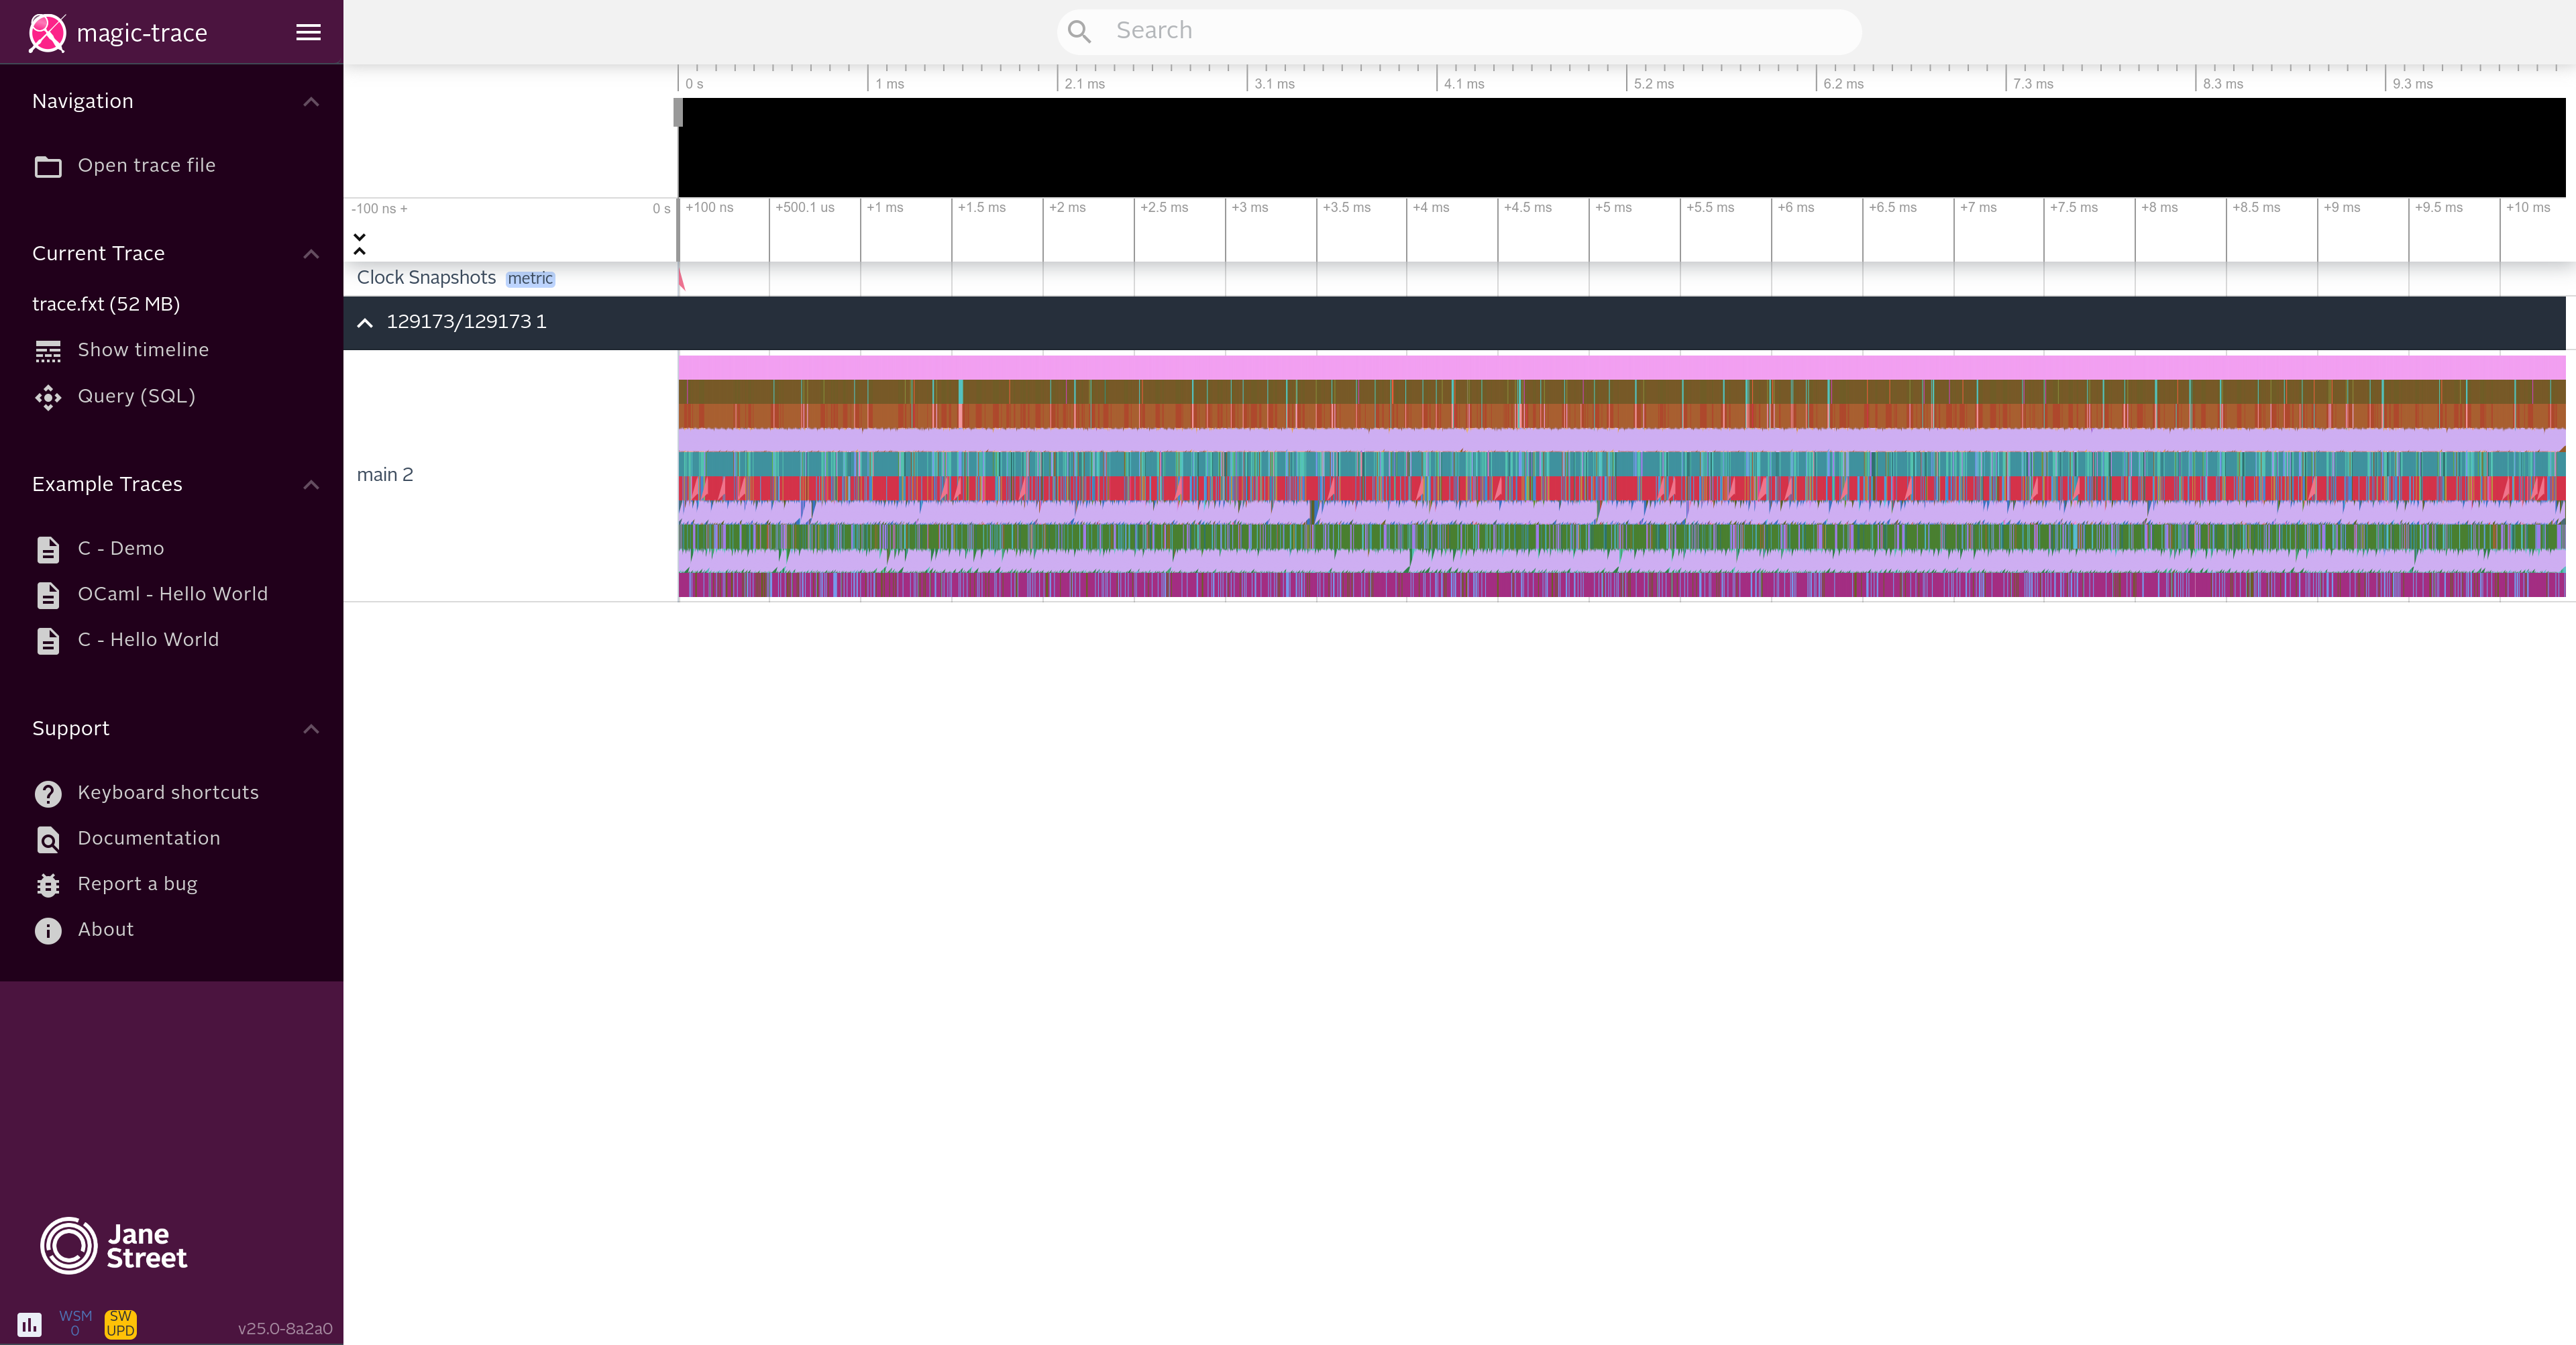
https://github.com/janestreet/magic-trace has detailed instructions on how to navigate this UI, but the keys W,A,S,D are a great start.
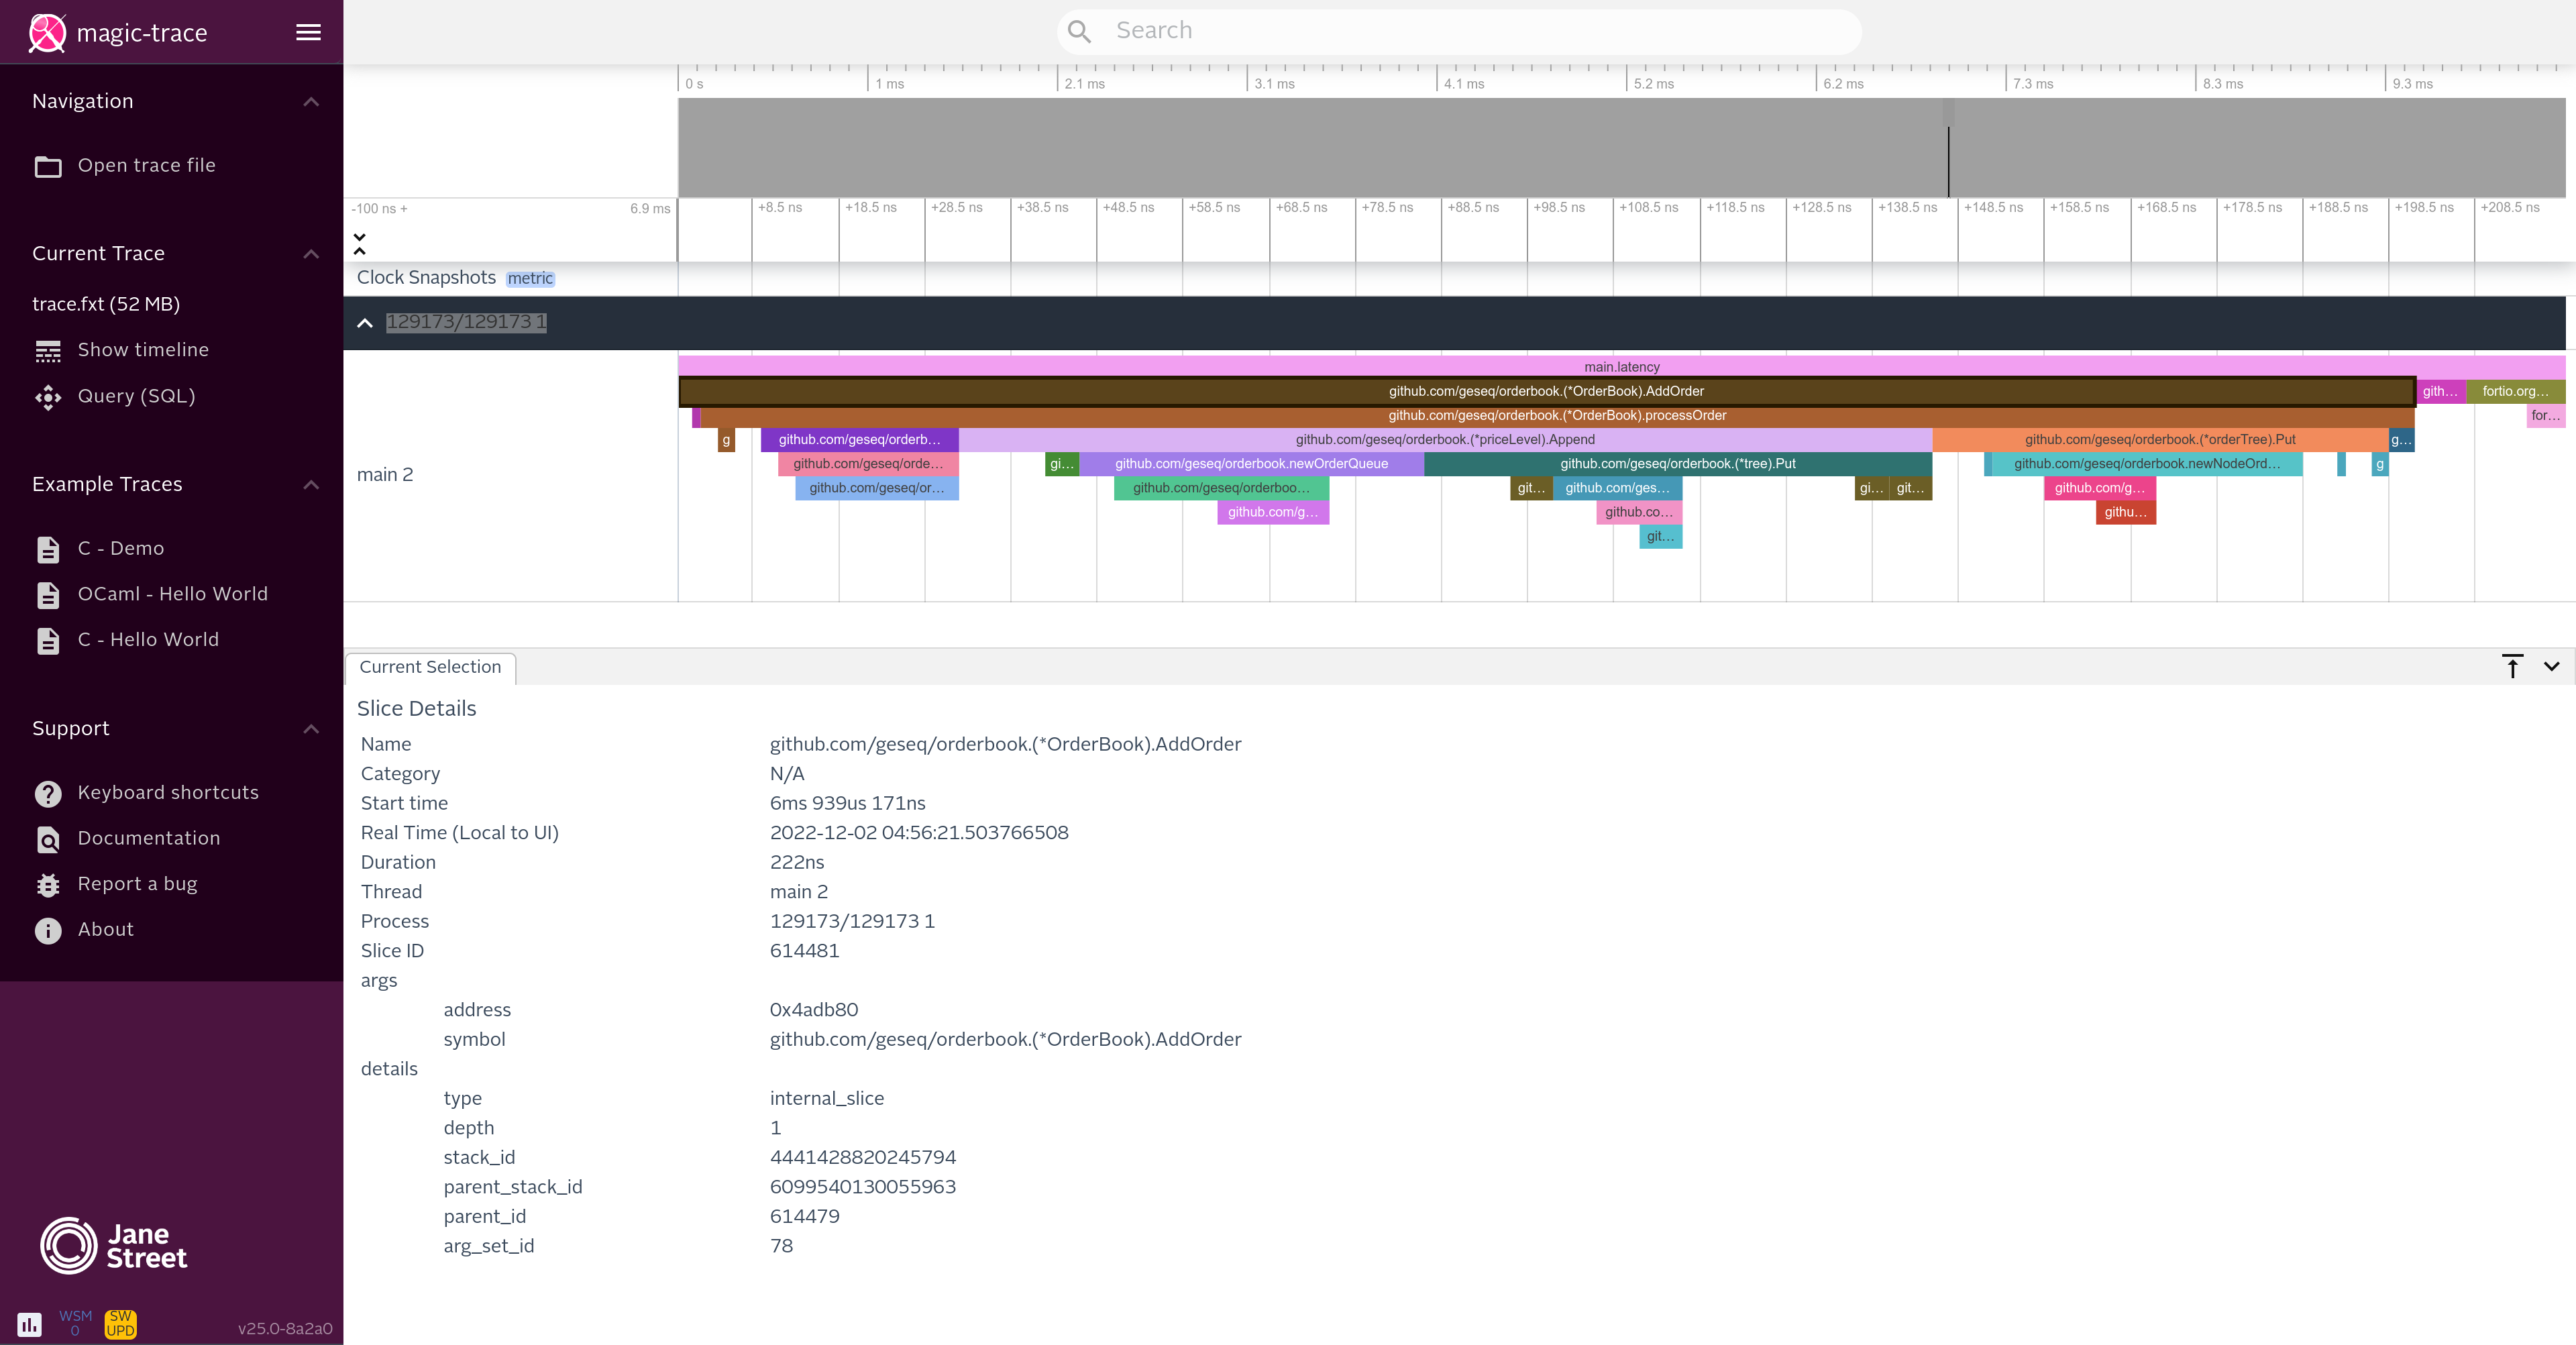
Following shows an ~200ns zoomed in view and a single slice selected:
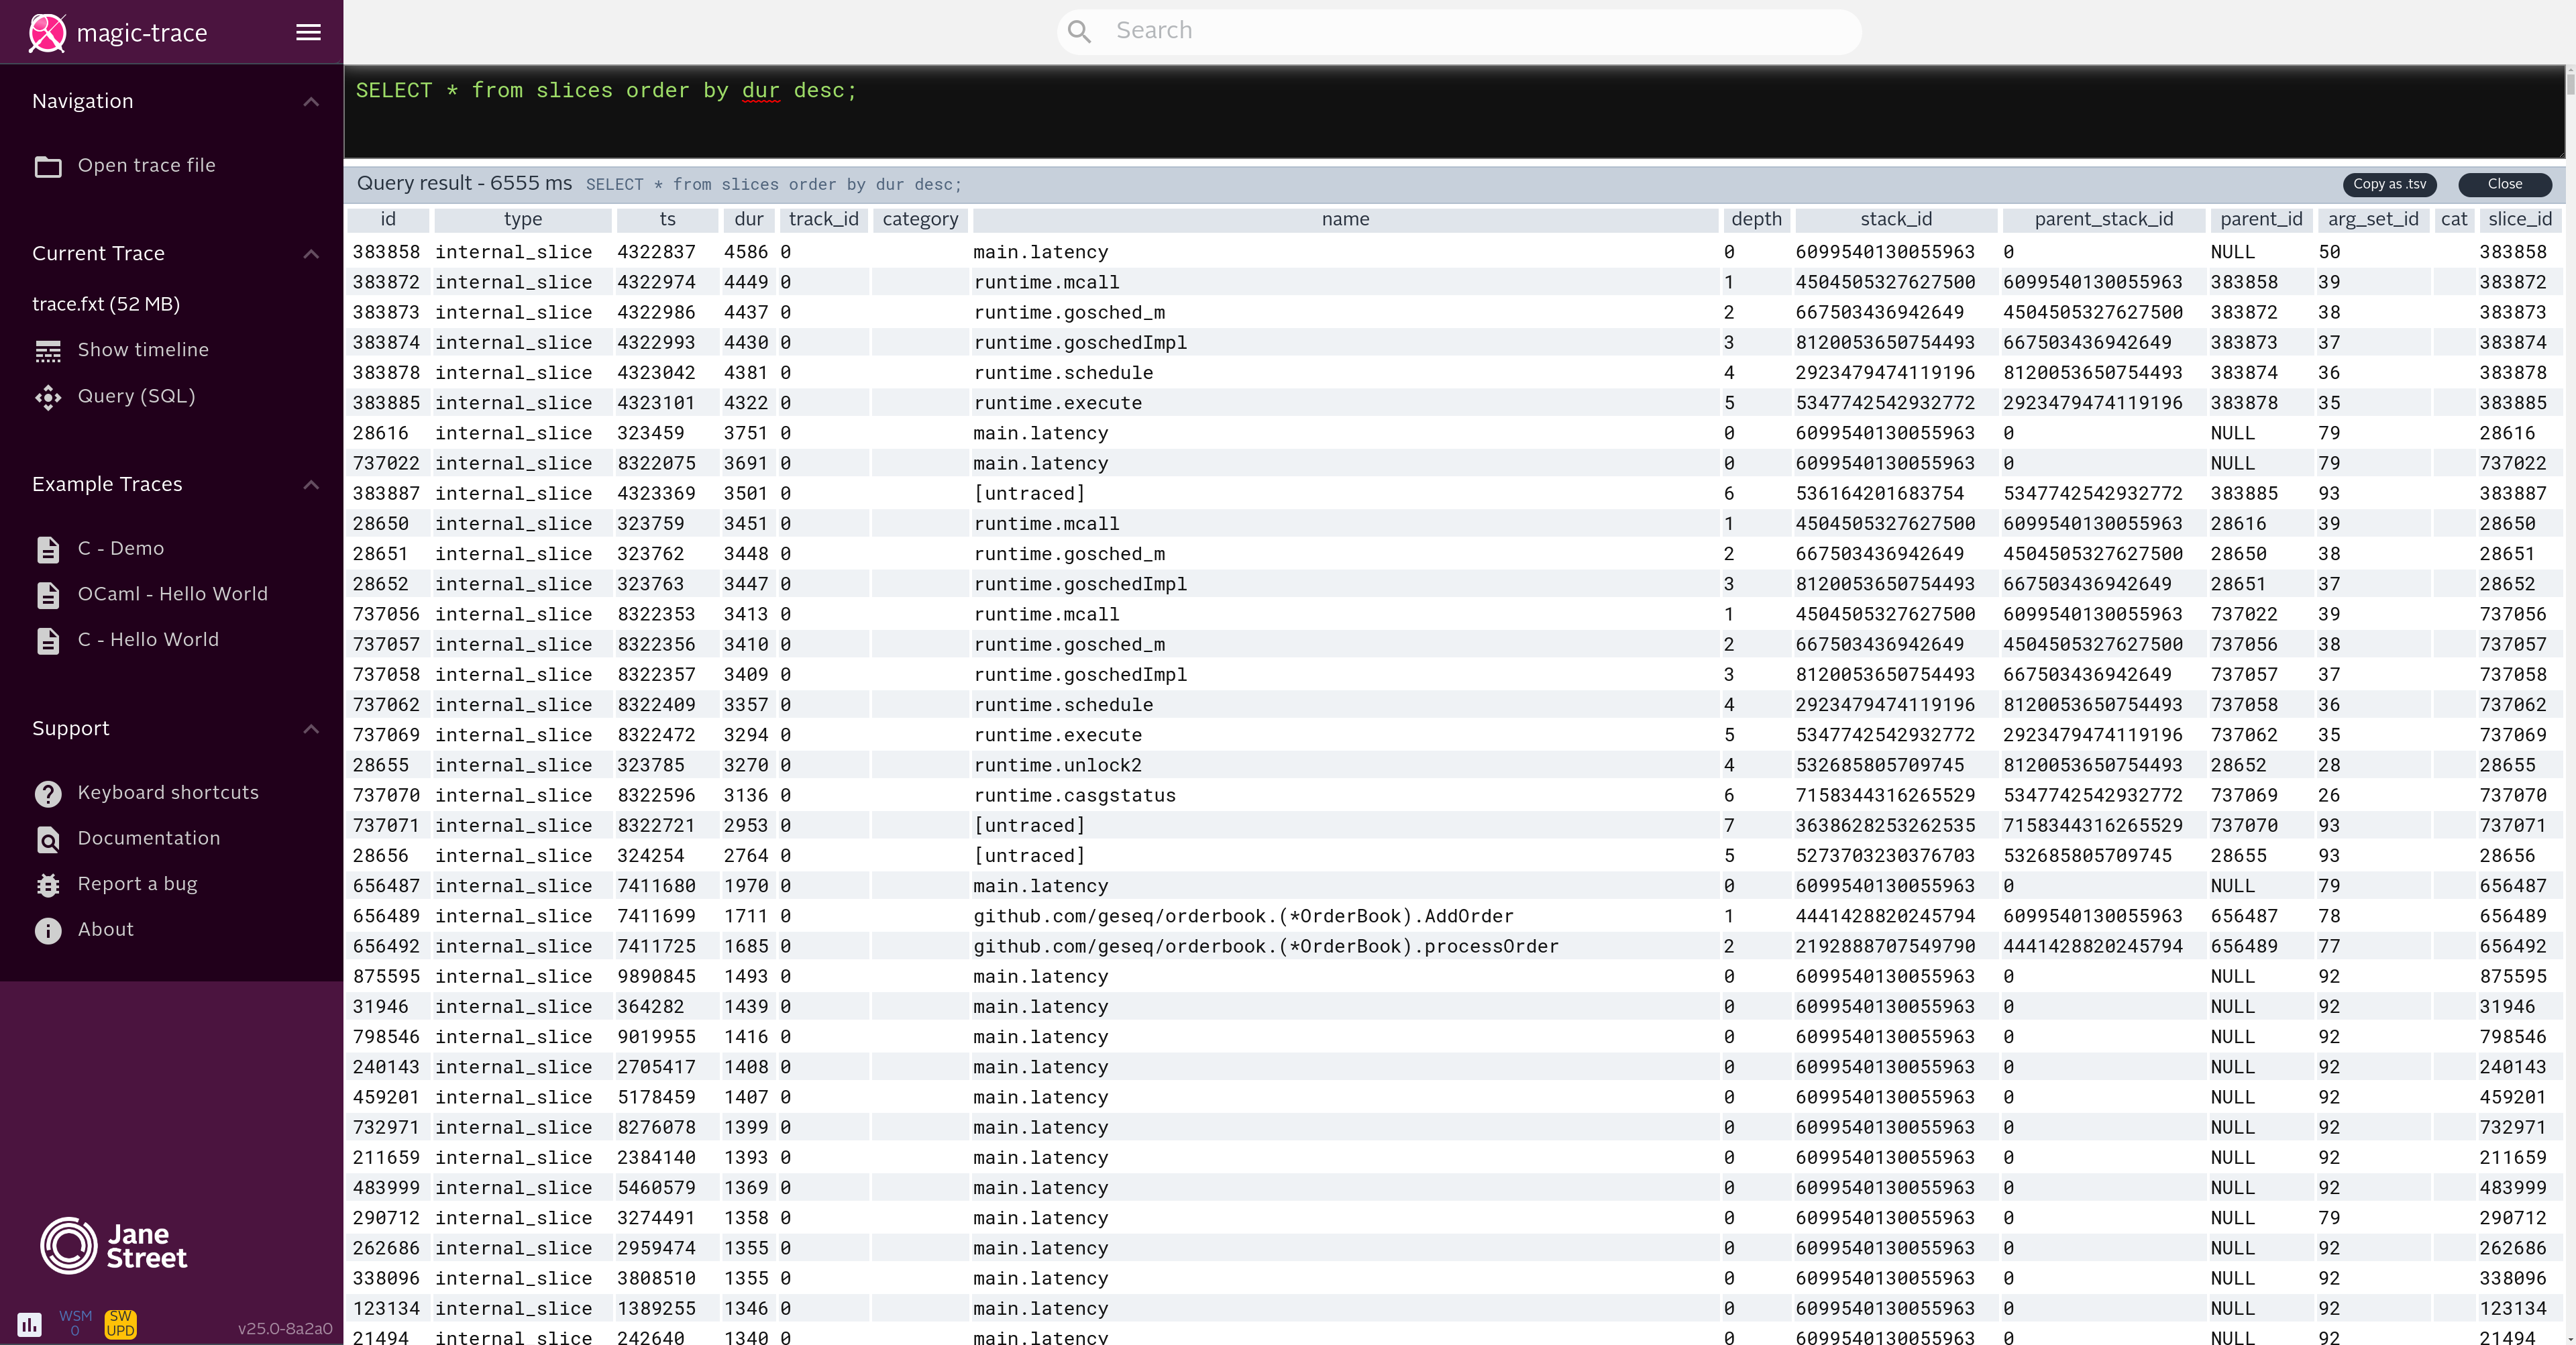
It’s also possible to query the information in the trace using SQL. Following shows the query:
| |
Ctrl+Enter to run the query.