Recently, I was asked to give a demo to the team on how to use perf to profile applications. I thought, why not turn this into a blog post? So here we are. As usual we’ll use my orderbook project to demonstate the commands.
What is perf?
perf is a powerful tool that comes with the Linux kernel, designed to help you analyze and debug the performance of your applications. It’s an extremely versatile tools with a diverse set of capabilities. We’re going to focus only on application profiling for this post.
Disclaimers
Perf provides and excellent TUI what makes the whole process of profiling infinitely easier, but this post focuses on the STDIO interface as it’s unlikely that the TUI will always be available on remote servers.
This post is also not catered towards VM based languages such as Java.
Finally, perf also has the capability of using IPT. However, if you’d like to use IPT, you’re better off using Magic Trace which I have written about separately. Magic Trace uses perf under the hood.
Prerequisites
To use perf effectively, make sure:
- You have root or similar privileges on the system you are profiling.
- Your program should be compiled with debug symbols enabled. This will allow
perfto map the performance data it collects to the actual lines of source code.
Here’s how you can enable debug symbols in C++ and Go:
C++
For C++, you can use the -g flag with the g++ or clang++ compiler to enable debug symbols:
| |
Go
For Go, debug symbols are included by default when you use the go build command. However, if you’re using the -ldflags "-s -w" flags to strip debug information and reduce binary size, you’ll need to omit those flags to keep the debug symbols
Profiling with perf
Let’s get right to it. We’ll start with recording the profiling data using three different call-graph modes: lbr, dwarf, and fp. All of the following perf record commands generate a perf.data file, which contains the profiling data.
Run your workload
Let’s run the benchmark from my orderbook as an example here:
| |
Last Branch Record (LBR) Mode
LBR (Last Branch Record) is a hardware feature available on some CPUs that records information about the most recent branches that the CPU has executed. In the context of perf, LBR provides very low overhead and can offer high accuracy. When available, this is my method of choice. To check if LBR is available on your machine, run:
| |
The output of this command should include an ’lbr’ flag, indicating that LBR is supported.
To record a profile:
| |
-F 999specifies the frequency of sampling. In this case,perfwill sample the target 999 times per second. This is999instead of1000to reduce the possibility of lockstep sampling.-aspecifies thatperfshould monitor all CPUs.-gcaptures call-graphs.--call-graph lbrspecifies the method used to capture the call-graphs, in this caselbr--user-callchainsensures thatperfrecords call chains from user space only.-p $(pgrep <command>)specifies the process to profile. Replace<command>with the name of your process. In this casebench.-- sleep 30tellsperfto run for 30 seconds.
DWARF Mode
When LBR isn’t awailable, DWARF mode can be the next best thing, with a caveat. It comes with a significant overhead, which can sometimes make the FP mode a more preferable choice.
| |
Frame Pointer (FP) Mode
The overhead with FP is typically lower than DWARF, but it requires the program to be compiled with frame pointers enabled. Additionally, the FP method may not handle optimizations like tail call optimization or inlined functions accurately.
If you intend to use the Frame Pointer (FP) method for call-graph profiling with perf, you should ensure that your program is compiled with frame pointers enabled. In C++, you can do this by using the -fno-omit-frame-pointer flag:
| |
To record:
| |
Analyzing Profiling Data
Now that we have our profiling data, let’s analyze it:
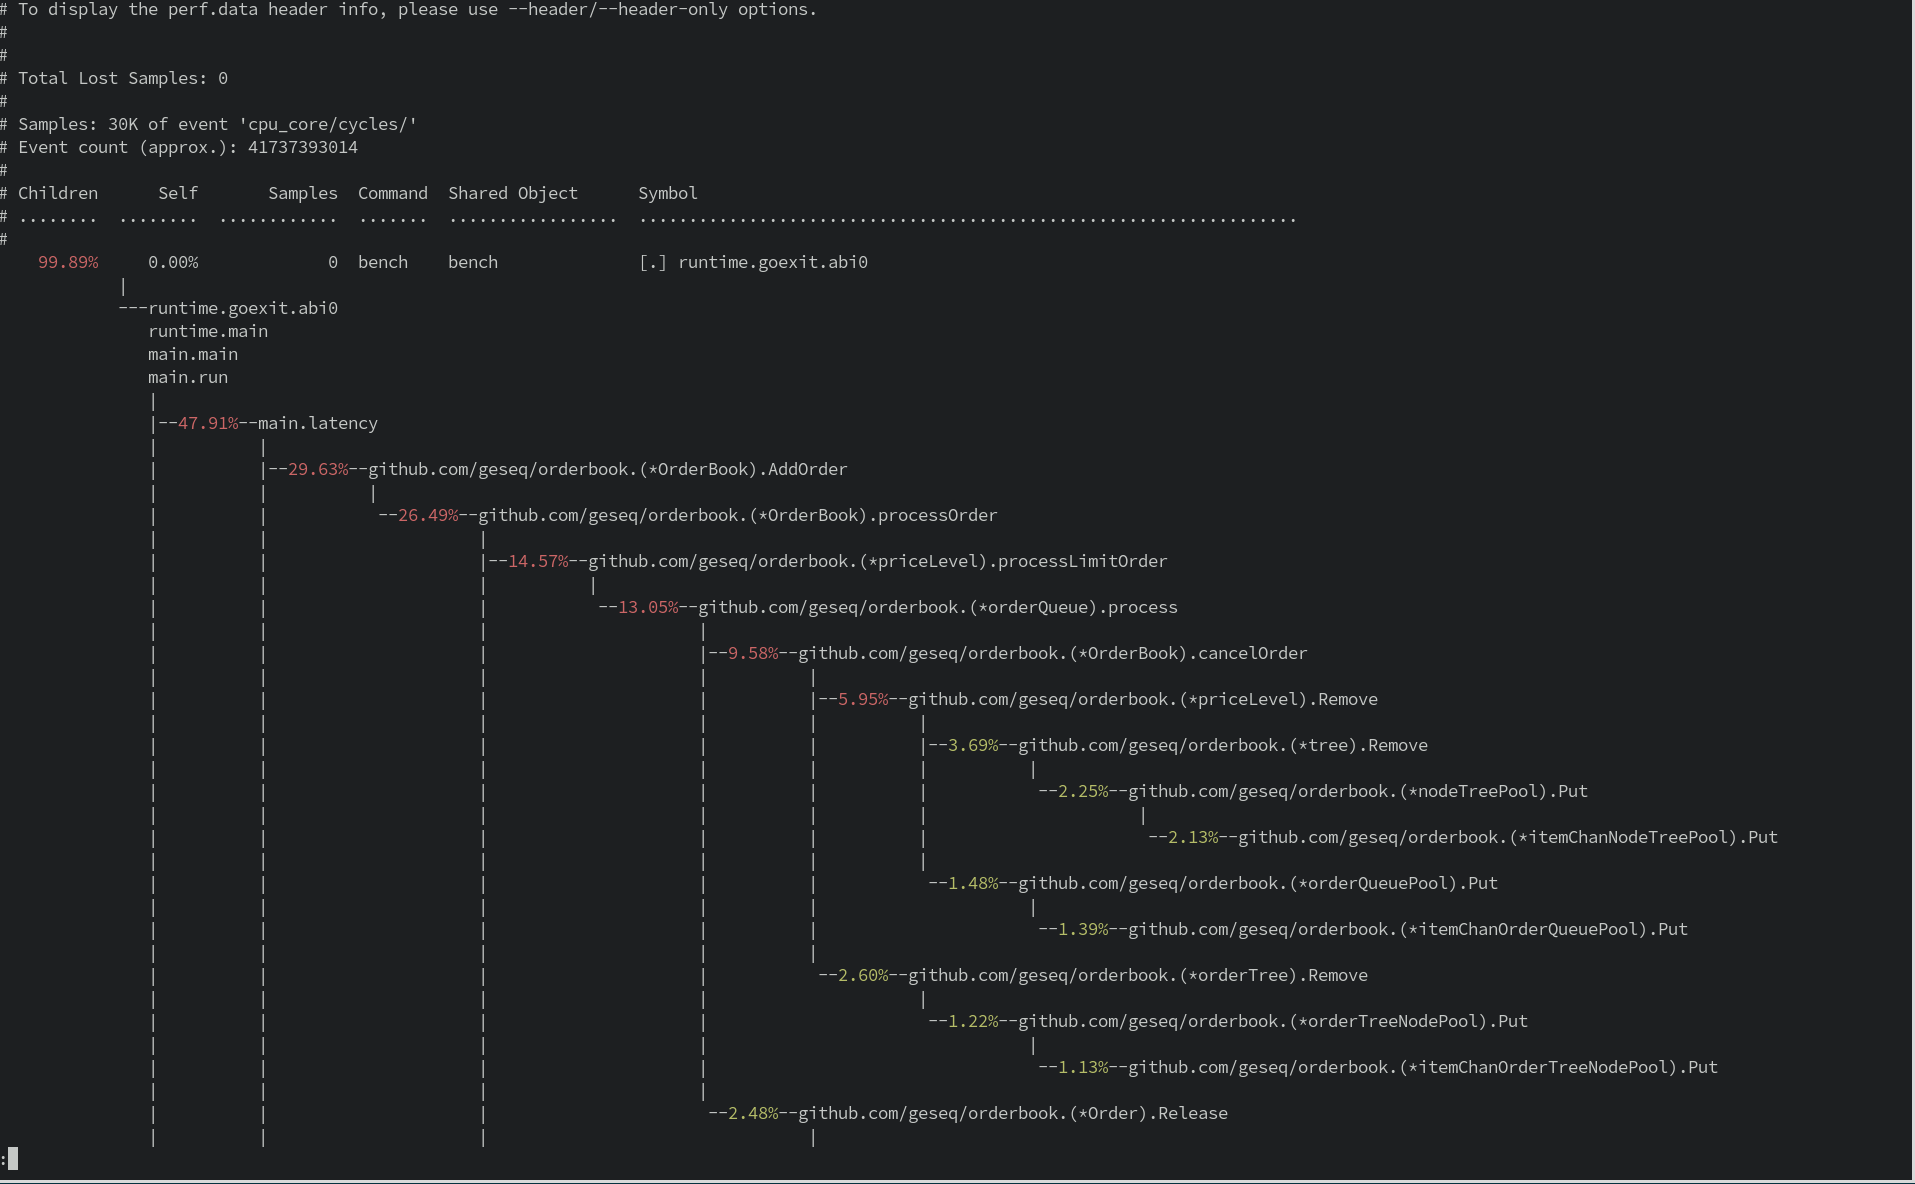
| |
-Guses the inverted call graph.-nshows a column with number of swamples
The perf report command reads the perf.data file and displays a summary of the profiling data.
Filtering Profiling Data
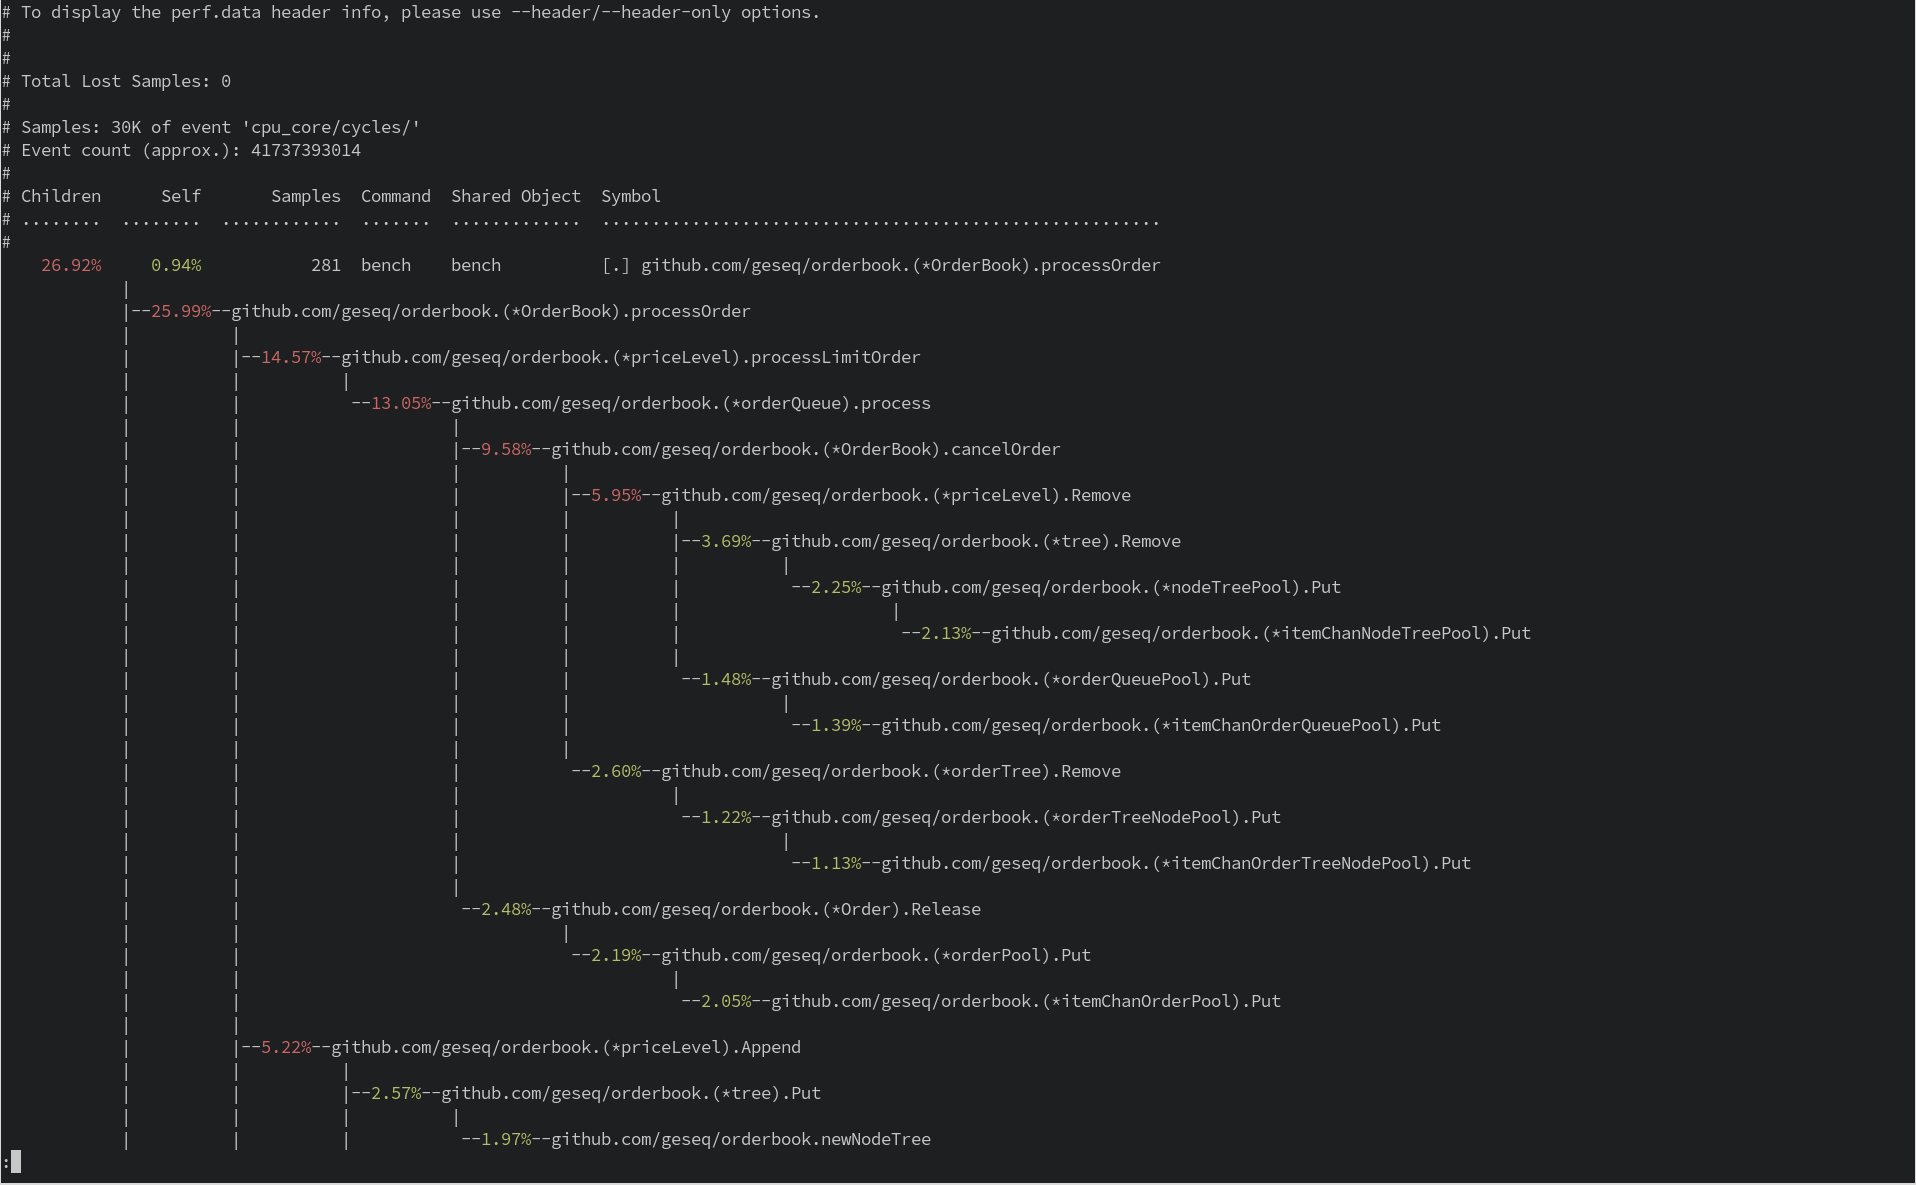
You might want to filter the profiling data based on specific symbols:
| |
This command filters the profiling data to only include those events related to the symbol processOrder.
Annotating Source Code
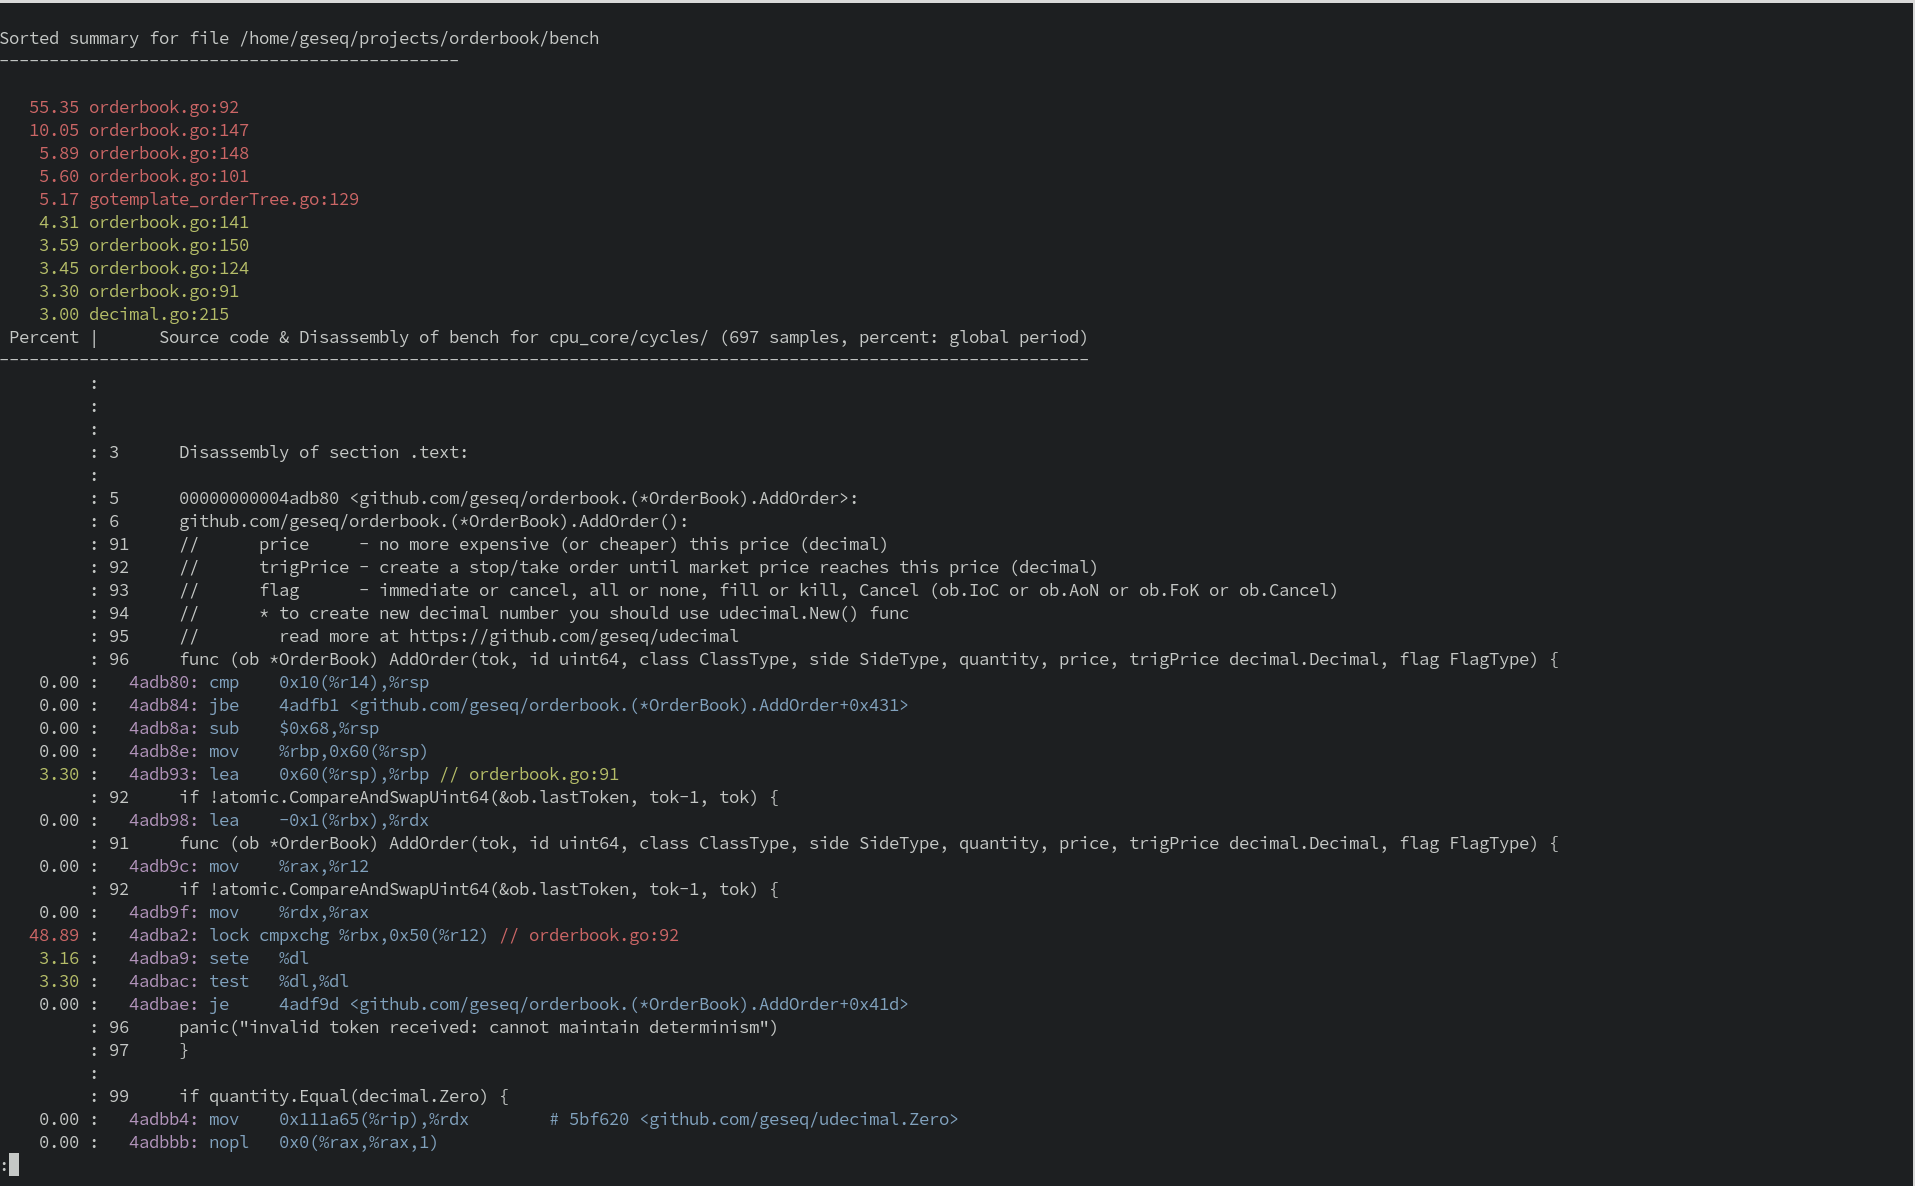
Finally, you might want to annotate your source code with the profiling data:
| |
-lspecifies thatperfshould include line numbers in the annotation.-sspecifies the symbol to annotate. In this case, it’s a Go function from the orderbook package.--sourcetellsperfto interleave source code with the assembly code in the annotation.
Flame Graphs
Flame graphs are a nice visualization trick allowing the most frequent code-paths to be identified quickly and accurately.
To create flame graphs, you need the FlameGraph tool suite.
| |
Creating a Flame Graph with perf data involves a couple of quick steps using the recording perf.data file created above:
Fold stacks: Use
perf scriptto generate an unfolded stack file, then fold it with thestackcollapse-perf.plscript from the FlameGraph tool suite.1$ perf script | <Path To FlameGraph>/stackcollapse-perf.pl > out.perf-foldedThis creates a new file
out.perf-foldedwith folded stack traces.Generate the Flame Graph: Now generate the flame graph with the
flamegraph.plscript.1$ <Path To FlameGraph>/flamegraph.pl out.perf-folded > perf-flamegraph.svgThis creates a Flame Graph
perf-flamegraph.svgfrom the folded stack traces.
Now, open the perf-flamegraph.svg in a web browser. This will help quickly and accurately identify the most frequent code-paths.
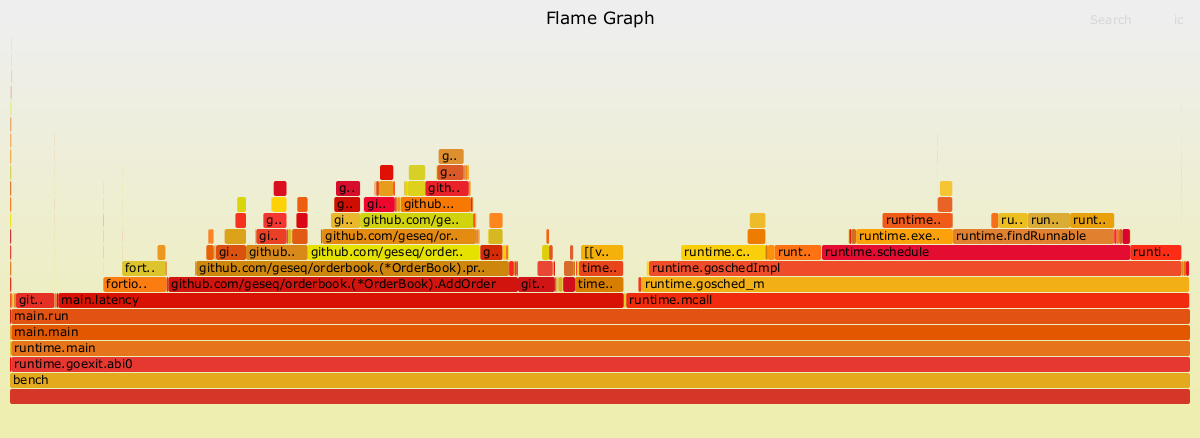
Each bar in the graph represents a stack frame. The wider a bar, the more frequently it was observed in the profile. The top edge shows what is currently running and beneath it the call stack. By sorting alphabetically, the colors are randomized but consistent across different flame graphs.
There you have it! A brief primer on using perf to profile your applications.